Natural Grocers by Vitamin Cottage (NGVC)·Q1 2026 Earnings Summary
Natural Grocers Beats Q1 EPS on Expense Discipline, Affirms Full-Year Outlook
February 5, 2026 · by Fintool AI Agent
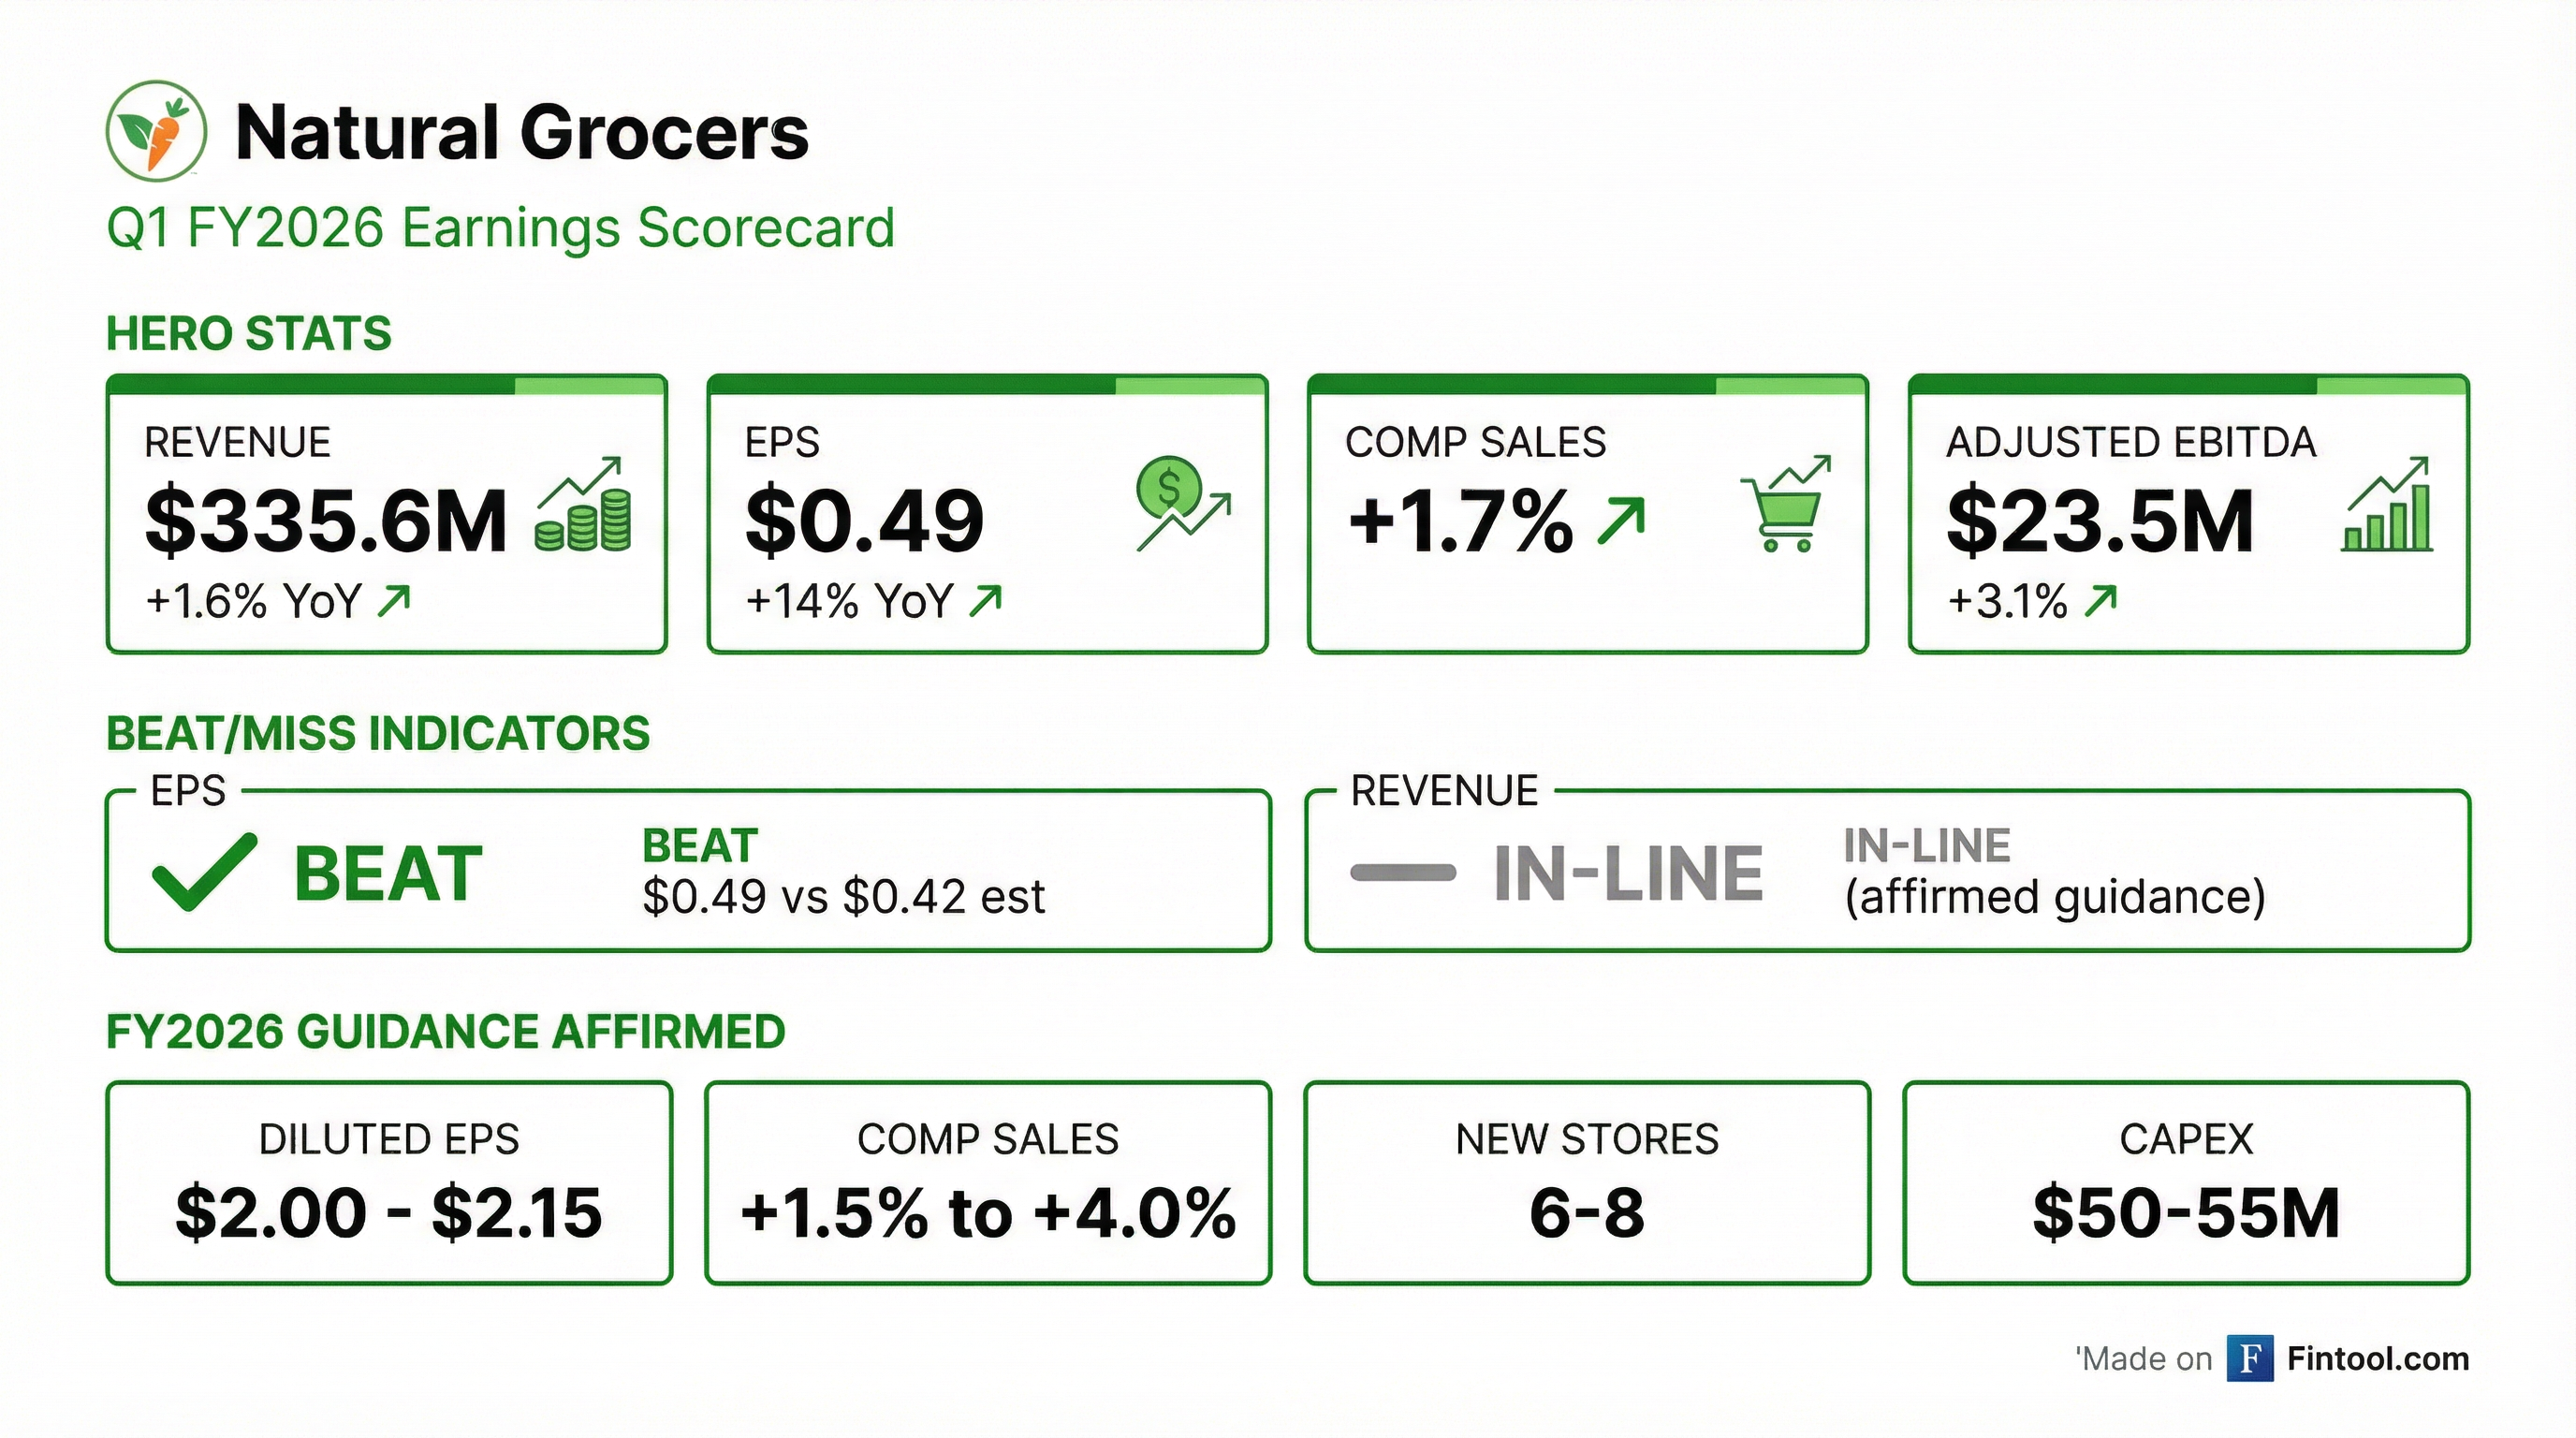
Natural Grocers by Vitamin Cottage (NGVC) reported Q1 FY2026 results that exceeded expectations on the bottom line. Diluted EPS of $0.49 beat the $0.42 consensus estimate by 17%, up 14% year-over-year despite modest revenue growth. The specialty organic grocer affirmed its full-year guidance, signaling confidence in its differentiated positioning amid a challenging consumer backdrop.
Did Natural Grocers Beat Earnings?
Yes — EPS beat, revenue in-line with expectations.
The beat was driven by expense discipline, not sales leverage:
- Store expenses fell to 21.8% of sales from 22.3% — expense management initiatives paying off
- Administrative expenses dropped to 3.2% from 3.5%, partly due to lapping CFO transition costs from the prior year
- Operating margin expanded 40 basis points to 4.4% despite gross margin pressure
The headwind: Gross margin contracted 40 bps to 29.5% due to higher inventory shrink. Management attributed this to cycling unusually low shrink last year, plus isolated events including weather-related power outages and store closures.
What Did Management Guide?
Guidance affirmed — no changes to the full-year outlook.
Co-President Kemper Isely noted results were "in-line with expectations" and reiterated confidence in the company's differentiated positioning: "Our differentiated selection of high-quality natural and organic products, enhanced by our Always Affordable pricing strategy, continue to deliver strong value and reinforce our competitive position amid economic uncertainty."
With Q1 EPS of $0.49 representing ~23-25% of the $2.00-$2.15 full-year target, the run-rate supports the guidance range assuming typical seasonality.
What Changed From Last Quarter?
Sequential comp deceleration, but margin profile improved.
Comp sales moderated from Q4's 2.9% to 1.7%, but management emphasized this quarter was cycling a strong 8.9% comp from Q1 FY2025. The result remains solid relative to the 1.5%-4.0% guidance range. The gross margin decline is largely a reporting period artifact — fiscal Q1 historically runs lower than Q4 due to mix and promotional timing.
Positive trend: On a two-year stacked basis, comps of +10.6% demonstrate the durability of customer traffic gains post-pandemic.
Key Financial Trends
Revenue Growth (Last 8 Quarters)
Revenue growth has decelerated as the company laps strong prior-year comps. Management views this as normalization rather than deterioration.
Profitability Trends
Operating margins remain stable in the mid-4% range, with expense leverage offsetting product margin pressure.
Balance Sheet & Capital Allocation
Natural Grocers maintains a conservatively financed balance sheet:
Dividend: The company declared a $0.15 per share quarterly dividend, payable March 18, 2026 to shareholders of record March 2, 2026. At current prices, this implies an annualized yield of ~2.2%.
How Did the Stock React?
Pending — Earnings were released after market close on February 5, 2026. The stock closed at $27.03, down 1.3% on the day prior to the release.
The stock has pulled back significantly from its 52-week high of $47.05, creating potential value if the company can sustain its profitability trajectory.
Key Takeaways
- EPS beat on costs, not sales — Expense discipline drove the earnings upside despite gross margin headwinds from shrink
- Guidance affirmed — No change to FY2026 outlook of $2.00-$2.15 EPS, suggesting management confidence
- Comp sales moderating but healthy — 1.7% growth within guidance range; two-year stack of 10.6% shows durable traffic
- Shrink remains a headwind — Inventory shrink pressured gross margins; industry-wide issue for grocers
- Strong cash generation — $21M operating cash flow supports dividend and store growth investments
Q&A Highlights
Shrink Breakdown
CFO Richard Hallé provided granular detail on the gross margin pressure from inventory shrink:
"Last year [shrink] was running about 15% below our three-year average. This quarter, we're probably running about 10% above our three-year average." — Richard Hallé
$0.12 EPS Investment in Growth
Natural Grocers is investing ~$0.12 per share in new store openings this fiscal year, primarily through higher pre-opening expenses. Co-President Kemper Isely noted that with the acceleration from two new stores last year to eight this year, the headwind is front-loaded:
"This year we're accelerating our growth from two new stores to eight, so that definitely gives us quite a bit of more preopening expense... Next year, if we open a consistent eight new stores and do a couple remodels, it should be fairly flat going forward."
Consumer Dynamics: Loyalty Members vs. Casual Shoppers
Management highlighted a divergence in customer behavior:
- {N}power rewards members — "really robust" with continued traffic and basket growth
- Non-members/less engaged shoppers — pulling back, particularly income-constrained consumers
- {N}power penetration — increased 2 percentage points to 83% of net sales
"The demographic that's income-constrained has pulled back... their paychecks aren't keeping up with the rate of inflation, and they're looking for as inexpensive of alternatives as they possibly can find." — Kemper Isely
Category Performance
Despite category mix headwinds, "overall, our cash register ring margin was flat for the quarter" due to offsetting margin gains in other categories.
Store Development Update
- One closure: Austin – Arbor Walk (Texas) in October 2025
- No additional closures planned for FY2026 or FY2027
- Total activity: 6-8 new stores + 1-3 relocations/remodels = 8-11 total projects
Forward Catalysts
- Q2 FY2026 earnings (expected May 2026) — comp sales trend and margin trajectory
- New store openings — 6-8 planned for FY2026, weighted to back half of year
- Shrink mitigation — management initiatives to address inventory loss
- Consumer backdrop — organic/natural category resilience in uncertain economy
- {N}power expansion — continued membership growth as key comp sales driver
Data sourced from company filings, earnings call transcript, and S&P Global. Estimates reflect consensus as of February 5, 2026.